Lab 01
PSYC480
Harriet Grace
University of Canterbury
2024-03-19
MATLAB and EEGLab
What is MATLAB?
- Programming language
- Matrix manipulations, plotting, implementing algorithms etc.
- Toolboxes and apps
What is EEGLab?
- A MATLAB toolbox
- Used for processing and analysing EEG, MEG and other electrophysiological signals.
- It has a GUI
Processing and analysing EEG data
- MATLAB command line
- The standalone EEGLab software
- Use EEGLab in association with MATLAB
Demonstration
Pipeline

How to process using EEGLab
- Use the available dataset from Learn
Lab 1 demo. - Note “Channels per frame, Frames per epoch, epoch, events, sampling rate, reference and other attributes.
How to process using EEGLab
- Epoch: A procedure in which specific time-windows are extracted from the continuous EEG signal. These time windows are called “epochs”, and usually are time-locked with respect an event e.g. a visual stimulus.
![]()
Attributes contd…
- Event: a visual stimuli or a task
- Sampling rate (Hz): the number of samples (of electrical activity) recorded per second
- Frames: Frames in EEGLAB are the same as samples (so if you sampled at 500 Hz your data will have 500 frames each second)
- Referencing: EEG recordings measure differences in electrical potentials between two points (Voltages). This means the signal displayed at any channel is in fact the difference in electrical potential to some other recording site (or reference).
Visualising EEG data
- Use
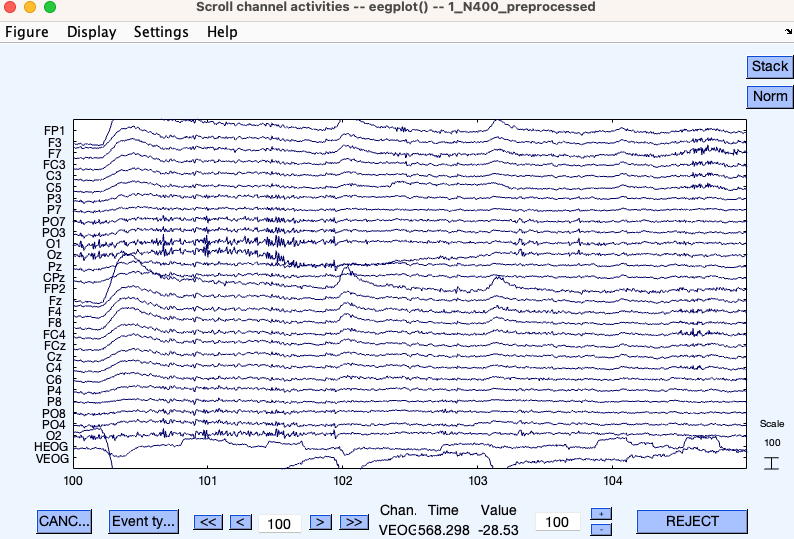
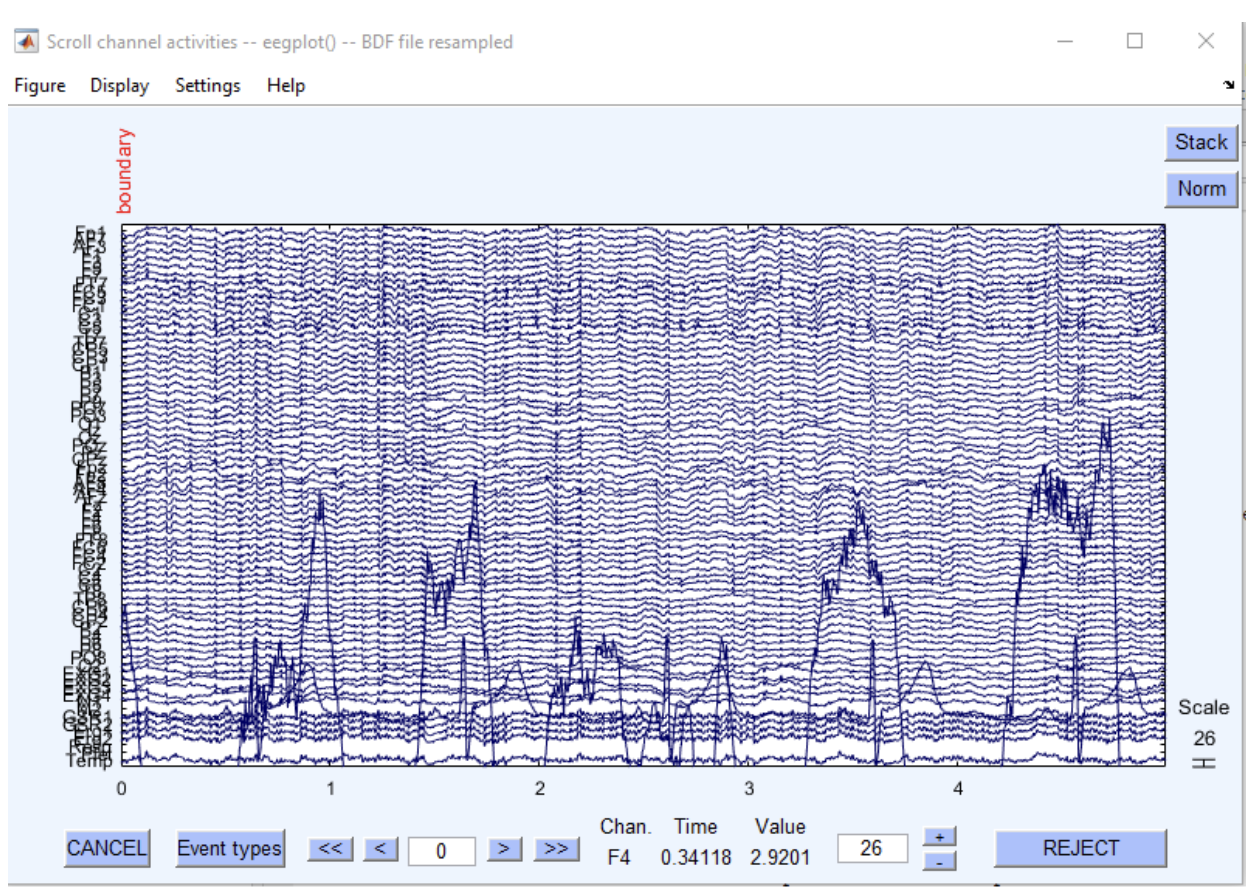
Plot -> Channel data (scroll).

Referencing
- Why do we reference?
Referencing to M1 and M2
- Use
Tools -> re-reference the data. - Compare the attributes to the original dataset. Is there any discrepancy? If yes, why?
- If you haven’t picked answer to “why” yet, plot the data again and observe closely.
Filtering
- Why do we filter data?
- Many sources of noise, such as the 60Hz line noise, consist mainly of very high frequencies or very low frequencies, whereas most of the useful information in an EEG or ERP waveform is at intermediate frequencies (between approximately 0.1Hz and 50Hz).
Filtering contd….
Consequently, the noise can often be reduced with minimal impact on the EEG/ERP waveform by filtering out the very low and/or very high frequencies.
Delorme recommends filtering at 0.5.
Use
Tools -> Filter data -> basic FIR Filter. Type 0.5 in theLower edgeDC offset: https://relaytraining.com/what-is-dc-offset-ask-chris/
Visaul inspection….
- From
Edit, selectchannel locations - Plot channels as
2-D
Removing unwanted channels
Use Edit -> Select data. Select the Channel range that you want to remove.
Examining raw data
- To identify artefacts
- And to reject them
- Use
Tools -> Inspect/reject data by eye.Use your mouse to highlight the part you want to reject, and click theREJECTbutton.

Automatic artefact rejection
Use Tools -> Reject data using Clean Rawdata and ASR. Generally, we’d use all default choices - Consequently, the noise can often be reduced with minimal impact on the EEG/ERP waveform by filtering out the very low and/or very high frequencies.
Exercise
To submit
- Use the the
Lab 1 exercisedataset on Learn. - Read it in to the EEGLab
- Report all attributes
- Insert a screenshot of the attributes
- Plot data using the scroll option
- Insert a screenshot
- Report your observation: do the data look similar to
demonstration? What do you see as a potential difference?
To submit continued
- Plot channels as
2-D - Do you see any anomaly? Comment!
- Conduct automatic rejection with ASR.
- Report your findings in comparison with before artefact rejection.
- Submit this as a pdf on Learn.
